


Jessica Kendall-Bar
| ART + SCIENCE |
marine biologist & science communicator
Welcome
My research combines engineering, data science, ecology, and visualization to measure behavior and physiology of marine animals in a changing climate. For my dissertation, I developed a non-invasive system to record and visualize the sleep patterns of seals at sea published in Science.
AN INTERDISCIPLINARY APPROACH

DESIGN
Engineer new
biosensors


BIOLOGGING &
ENGINEERING
DATA VISUALIZATION &
SIMULATION
DATA SCIENCE, AI, &
MODELING
ART &
STORYTELLING

Sleep at sea
As increasing human impact coincides with changing ecosystems, it is important to assess how our activities affect animals' natural behavior. Marine mammal sleep had only been studied in the lab. For my dissertation, I combined art, engineering, and biology to develop a system to monitor and visualize the sleep patterns of seals at sea. These tools allow us to learn more about where, when, and how animals sleep at sea so that we can better manage and protect their critical resting habitats.

DESIGN
I designed a surface-mounted system for non-invasive recordings of sleep at sea.
Kendall-Bar et al.
Eavesdropping on the Brain at Sea
Animal Biotelemetry (2022).

VISUALIZE
I designed a visualization toolbox to allow us to see their behavior alongside their neurological state.
Kendall-Bar et al.
Visualizing Life in the Deep
IEEE VIS (2021).

APPLY
I applied the EEG-derived sleep patterns of wild seals to interpret sleep patterns at the population level.
Kendall-Bar et al.
Brain activity of diving seals
Science (2023).


_edited.jpg)


PUBLICATIONS
*** Non-peer-reviewed publication: doctoral dissertation.

SCIENCE COMMUNICATION&
DATA VISUALIZATION
VIDEOS & ANIMATIONS


MAPS & INFOGRAPHICS

Comparing two futures: modeling the impact of future reef degradation on flooding in Florida
The future loss of reefs will increase flood risk in Florida. The map displays the projected loss in height of reefs (blue) off Miami by 2100 based on current rates of degradation. The 100-year floodplain would increase substantially (orange) based on this reef loss alone. Increases in sea level, storms, population, and development would add further risk.
Map created in collaboration with Jessica Kendall-Bar and Chris Lowrie using data from UCSC & USGS Report: Storlazzi et al. 2021 https://pubs.er.usgs.gov/publication/ofr20211055

Modeling the Impact of Future Coral Reef Degradation in Florida
The consequences of projected future reef degradation in Florida. The map identifies where further reef loss will increase risks the greatest. The size of the circles indicates the increase in annual expected economic damages per kilometer of coastline.
Map created in collaboration with Jessica Kendall-Bar and Chris Lowrie using data from UCSC & USGS Report: Storlazzi et al. 2021 https://pubs.er.usgs.gov/publication/ofr20211055

Where to restore reefs in Puerto Rico?
Risk Reduction Benefits of Reef Restoration. The full height of the bars indicates current expected flood risk in the 100-year floodplain in Miami, Florida. The blue bar tops indicate the risk that could be reduced with reef restoration; their height and color represent the expected benefit from restoration per 100,000 m2 (hexagon max width = 392 m). Residual risk remains even after reef restoration. The orange line offshore indicates the location of potential reef restoration assessed in the models. The blue polygons offshore represent the extent of current reef habitats.
Map created in collaboration with Jessica Kendall-Bar and Chris Lowrie using data from UCSC & USGS Report: Storlazzi et al. 2021 https://pubs.er.usgs.gov/publication/ofr20211054

The Impact of Hurricanes Irma & Maria on Flooding due to Coral Reef Damage
Hurricane Damage to Coral Reefs Increases Future Flood Risk. The blue polygons show the results of NOAA surveys of damages to reefs after Hurricanes Irma and Maria in 2017 around San Juan, Puerto Rico. The white bars indicate expected flood risk in the 100-year floodplain before the hurricanes and the colored bar tops indicate how much risk has increased because of damages to reefs per 50,000 m2 (hexagon max width = 277 m).
Map created in collaboration with Jessica Kendall-Bar and Chris Lowrie using data from UCSC & USGS Report: Storlazzi et al. 2021 https://pubs.er.usgs.gov/publication/ofr20211056

The Million Dollar Reefs of Puerto Rico
A map showing the reefs of Puerto Rico that provide over one million dollars of estimated flood protection benefits each year. Map created in collaboration with Jessica Kendall-Bar and Chris Lowrie using data from UCSC's Coastal Resilience Lab: Reguero et al. 2019.

The Million Dollar Reefs of Florida
A map showing the coral reefs of Florida that provide over one million dollars of estimated flood protection benefits each year. Map created in collaboration with Jessica Kendall-Bar and Chris Lowrie using data from UCSC's Coastal Resilience Lab: Reguero et al. 2019.

The Million Dollar Reefs of Oahu
A map showing the coral reefs of Oahu that provide over one million dollars of estimated flood protection benefits each year. Map created in collaboration with Jessica Kendall-Bar and Chris Lowrie using data from UCSC's Coastal Resilience Lab: Reguero et al. 2019.

The Wave Power Project
This infographic, painted in Procreate and assembled in Adobe Photoshop by Jessie Kendall-Bar, aims to communicate the consequences of reef loss as well as the power of waves. The aim of this work is to communicate to policymakers and stakeholders the consequences of waves and the benefits of reefs. These decision-makers, even those in coastal districts, rarely understand how critical reefs are to preserving lives, livelihoods and property. This work has been presented to top level decision makers at forums with leaders across the US, Pacific and Indian Ocean nations. This included a forum with the 4 atoll nations of the world whose entire existence depends on reefs. The work was funded by the US Department of the Interior and the Kingfisher Foundation.

A year in the life of an elephant seal
Infographic showing the annual cycle of northern elephant seals at Ano Nuevo, incorporating real data on the mass of animals over time and explaining the long-term data collection effort spearheaded by Dan Costa and a large number of past and current contributors to this research effort (See full list of researchers in the graphic below).

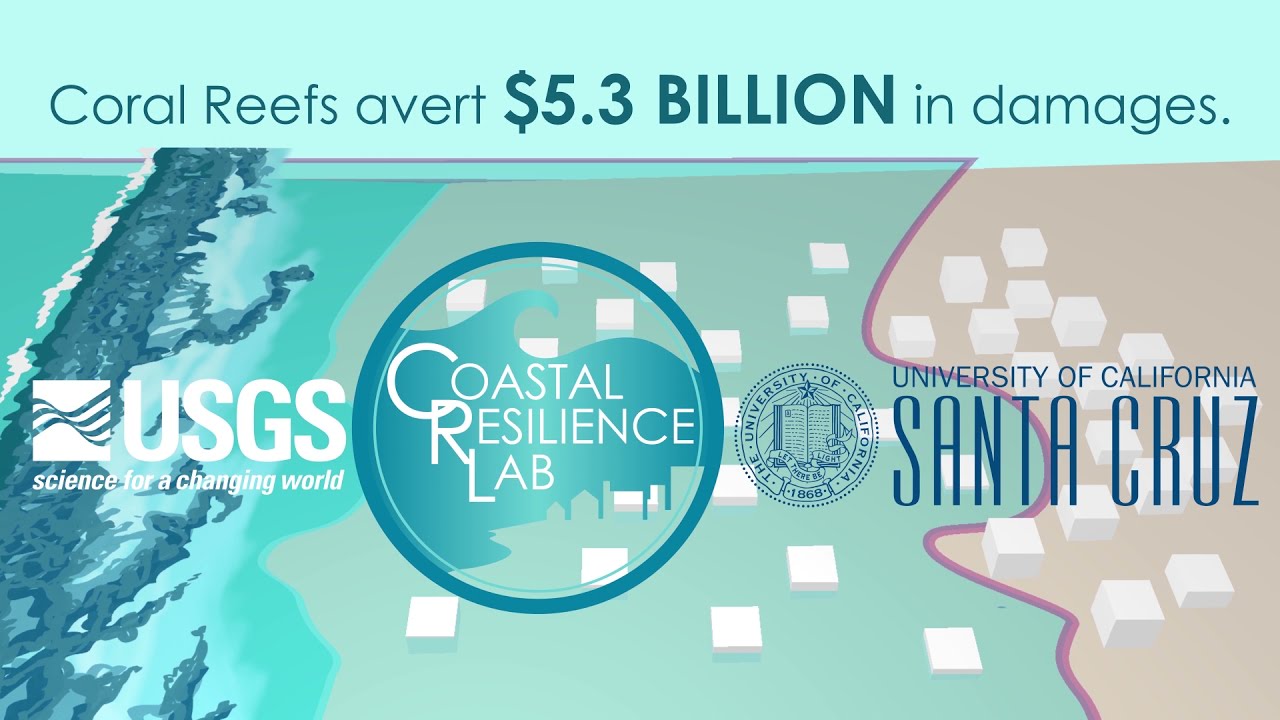
Coral Reef Flood Protection Benefits Infographic
Infographic demonstrating results from a Nature Sustainability article by Borja Reguero, Mike Beck, and colleagues at UCSC, TNC, & USGS showing the protective benefits of coral reefs.

Cascading effects in kelp forests
Graphical abstract for PNAS paper by Josh Smith et al., describing the shifts in California's subtidal ecosystem since the sea star wasting disease in 2013. Click the image to read the paper and learn more.